pythonのCounterについて
アドベントカレンダー18日目です。
今日はPythonのCounterについて書いていきます。
Counterとは?
与えられた要素について数を数えます。公式の例がわかりやすいです。
c = Counter()                           # a new, empty counter
c = Counter('gallahad')                 # a new counter from an iterable
c = Counter({'red': 4, 'blue': 2})      # a new counter from a mapping
c = Counter(cats=4, dogs=8)             # a new counter from keyword args
8.3. collections — コンテナデータ型 — Python 3.6.3 ドキュメント
Counterを使ってみる
使い方は簡単です。 collectionsからCounterをimportします。 後は、Counterに要素を投げることで、数え上げて辞書型で保存します。極めて簡単ですね。
from collections import Counter

print(Counter("aiueooiusiuuu"))
>>> Counter({'u': 5, 'i': 3, 'o': 2, 'e': 1, 's': 1, 'a': 1})
今回は、Counterに入力するデータとしてオバマさんの演説を持ってきました。なぜオバマさんの演説かというと、英語で形態素解析がいらなくて楽だからです。文章はここから持ってきました。 www.nikkei.com
前処理として、改行を消したり、「,」「.」を消したり、「-」を空白に置換し、大文字は全て小文字にしました。
Counterに入力し、試しに上位10件の単語を見てみましょう。
sentence = "" #オバマさんの演説
counter = Counter(sentence)
count = counter.most_common()
print(count[:10])
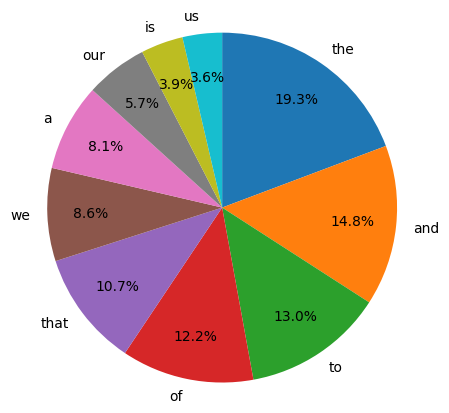
>>> [('the', 74), ('and', 57), ('to', 50), ('of', 47), ('that', 41), ('we', 33), ('a', 31), ('our', 22), ('is', 15), ('us', 14)]
上位10件で円グラフを書きました。ただしコレの%は全体から見た数値ではないので要注意です。
import matplotlib.pyplot as plt
%matplotlib inline

x = [x[1] for x in count][:10]
label = [label[0] for label in count][:10]

plt.figure(figsize=(5,5), dpi=100)
plt.pie(x, labels=label, startangle=90, counterclock=False, autopct='%.1f%%', pctdistance=0.75)
plt.axis('equal')
plt.show()
